

Home
Your site's headline KPIs, new opportunities, and the work already in progress.
Home opens whenever you switch into a site. You can see how the site is trending and what's waiting for you, so you can decide where to spend the next hour.
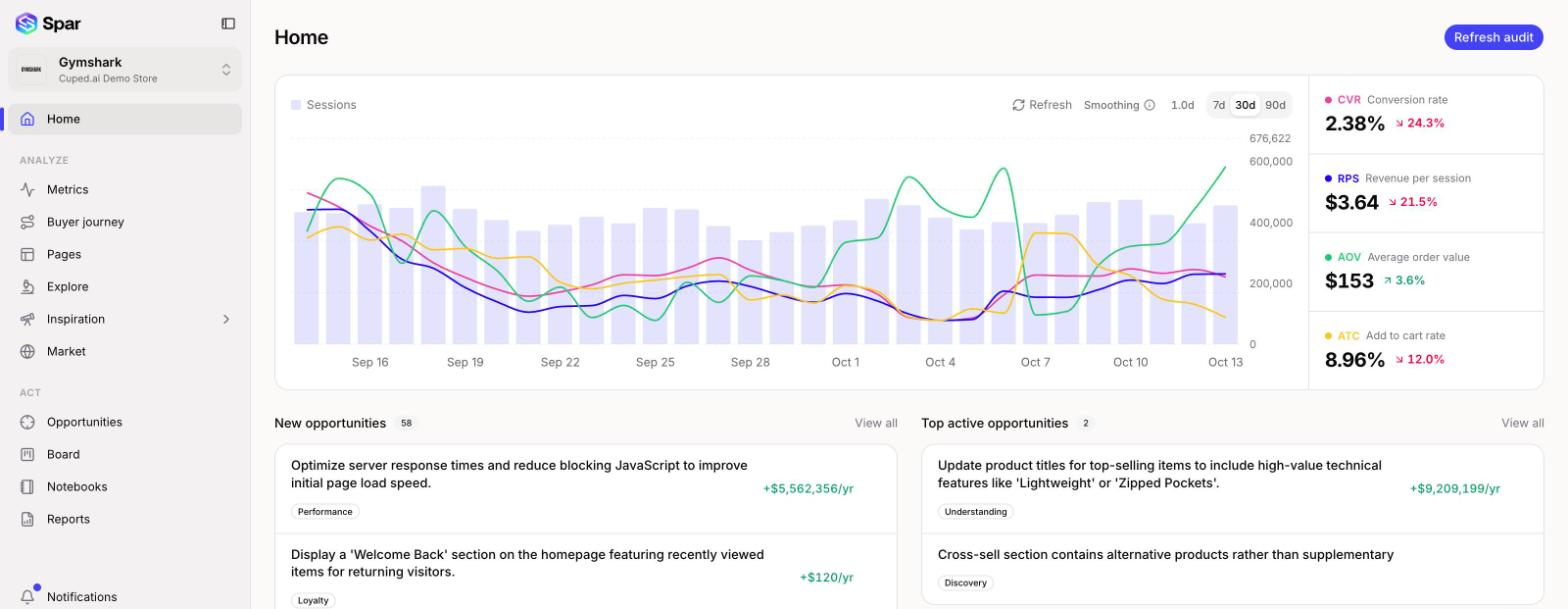
The KPI chart
The chart plots daily sessions as bars, with four lines on top:
- CVR: conversion rate
- RPS: revenue per session
- AOV: average order value
- ATC: add to cart rate
The rail on the right shows each one's current value and its change over the selected period. Switch between 7d, 30d, and 90d in the chart header, turn on Smoothing to even out day-to-day noise, or click Refresh to pull the latest numbers.
Opportunity lists
New opportunities lists ones you haven't triaged yet, each with its projected yearly revenue impact and journey stage tag. Top active opportunities lists the ones you've accepted and are working on. Click View all on either list to jump to Opportunities, or see Triage to work through the new ones.
Refresh audit
Refresh audit in the top right re-runs the audit on demand. See Running your first audit for when that's worth doing.
Connect more data
If you haven't connected every data source, Home shows an Enrich your next audit card with a shortcut to connect the next one (for example Connect Clarity). The full list lives in Settings > Integrations.
Last updated on